Lusaka IVF & Fertility Clinic
Making Families Complete
LIFC IVF STATS SUMMARY NOVEMBER TO DECEMBER 2015
A: Tabulated summary of 2015 IVF Data.
SN | Month/cycle 2015 | Embryologist | Total ET | Fresh ET | # Positive | % Success | FER | # Positive | % success | PGD | # Positive |
1 | November | Bart & In house | 8 | 8 | 2 | 25% | 0 | 0 | 0 | 0 | 0 |
2 | December | In house & Arnold | 13 | 13 | 3 | 23% | 0 | 0 | 0 | 0 | 0 |
Totals |
| 21 | 21 | 5 | 24% | 0 | 0 | 0% | 0 | 0 |
The year 2015 had two cycles. One in November and one in December.
Overall Fresh ET: 24%
Overall FER: 0% (no FER performed in 2015)
No PGD procedures done in 2015
Overall success rate: 24%
LIFC IVF STATS SUMMARY JANUARY TO DECEMBER 2016
A: Tabulated summary of 2016 IVF Data.
SN | Month/cycle 2016 | Embryologist | Total ET | Fresh ET | # Positive | % Success | FER | # Positive | % success | PGD | # Positive |
1 | January | Arnold & In house | 8 | 8 | 3 | 38% | 0 | 0 | 0% | 0 | 0 |
2 | February | Arnold & in House | 8 | 8 | 5 | 63% | 0 | 0 | 0% | 0 | 0 |
3 | March | Arnold & in house | 10 | 10 | 6 | 60% | 0 | 0 | 0% | 0 | 0 |
4 | April | Arnold & in house | 12 | 12 | 3 | 25% | 0 | 0 | 0% | 0 | 0 |
5 | May | Arnold & in house | 7 | 7 | 3 | 43% | 0 | 0 | 0% | 0 | 0 |
6 | June | Arnold & in house | 10 | 9 | 3 | 33% | 1 | 1 | 100% | 0 | 0 |
7 | July | Arnold & in house | 12 | 12 | 2 | 17% | 0 | 0 | 0% | 0 | 0 |
8 | August | Arnold & in house | 11 | 11 | 3 | 27% | 0 | 0 | 0% | 0 | 0 |
9 | September | Arnold & in house | 11 | 11 | 3 | 27% | 0 | 0 | 0% | 0 | 0 |
10 | October | Arnold & in house | 8 | 7 | 2 | 29% | 1 | 1 | 100% | 0 | 0 |
11 | November | Arnold & in house | 8 | 8 | 5 | 63% | 0 | 0 | 0% | 0 | 0 |
12 | December | Arnold & in house | 12 | 10 | 5 | 50% | 2 | 2 | 100% | 0 | 0 |
| Totals |
| 117 | 113 | 43 | 38% | 4 | 4 | 100% | 0 | 0 |
Overall Fresh ET success rates: 38%
Overall FER success rates: 100% (all four FER were a success in 2016)
No PGD performed in the year 2016
Overall success rates: 40%
Bar graph highlighting Fresh ET vs FER success rates for 2016
LIFC IVF STATS SUMMARY JANUARY TO DECEMBER 2017
A: Tabulated summary of 2017 IVF Data.
Overall Fresh Et success rates: 45%
Overall FER success rates: 27%
Overall success rates 2017:44%
No PGD procedures done in the year 2017
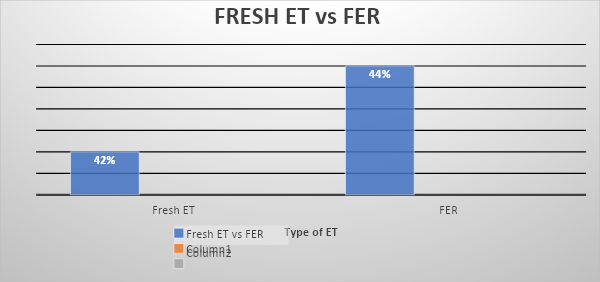
Bar graph highlighting Fresh ET and FER success rates of 2017
LIFC IVF STATS SUMMARY JANUARY TO DECEMBER 2018
A: Tabulated summary of 2018 IVF Data.
Overall Fresh ET success rates:42%
Overall FER success rates:44%
Overall PGD success rates:100% (both of the PGS procedures were a success)
Overall success rates:43%
Bar graph highlighting Fresh ET and FER success rates for the year 2018
LIFC IVF STATS SUMMARY JANUARY TO DECEMBER 2019
A: Tabulated summary of 2019 IVF Data.
SN | Month/cycle 2019 | Embryologist | Total ET | Fresh ET | # Positive | % Success | FER | # Positive | % success | PGD | # Positive |
1 | January | Claire & in house | 33 | 28 | 10 | 36% | 5 | 4 | 80% | 0 | 0 |
2 | February | Arnold & in house | 22 | 18 | 8 | 44% | 4 | 2 | 50% | 0 | 0 |
3 | March | Arnold & in house | 22 | 18 | 7 | 39% | 4 | 2 | 50% | 0 | 0 |
4 | April | Claire & in house | 26 | 22 | 10 | 45% | 4 | 2 | 50% | 0 | 0 |
5 | May | Arnold & in house | 20 | 16 | 8 | 50% | 4 | 3 | 75% | 2 | 0 |
6 | June | Isaac & in house | 18 | 15 | 5 | 33% | 3 | 1 | 33% | 0 | 0 |
7 | July | Arnold & in house | 20 | 8 | 3 | 38% | 12 | 7 | 58% | 4 | 2 |
8 | August | Ronnie & in house | 15 | 12 | 5 | 42% | 3 | 0 | 0% | 0 | 0 |
9 | September | Johan & in house | 34 | 33 | 13 | 39% | 1 | 1 | 100% | 0 | 0 |
10 | October | Yves & in house | 29 | 24 | 11 | 45% | 5 | 3 | 60% | 0 | 0 |
11 | November | Arnold & in house | 26 | 14 | 6 | 43% | 12 | 7 | 58% | 0 | 0 |
12 | December | Arnold & in house | 15 | 12 | 8 | 67% | 3 | 3 | 100% | 0 | 0 |
| Totals |
| 242 | 220 | 94 | 45% | 60 | 35 | 58% | 6 | 2 |
Overall Fresh ET success rates:45%
Overall FER success rates:58%
PGD success rates:33%
Overall success rates:53%
Bar graph highlighting Fresh ET and FER success rates in the year 2019
LIFC IVF STATS SUMMARY JANUARY TO DECEMBER 2018
A: Tabulated summary of 2020 IVF Data.
SN | Month/cycle 2020 | Embryologist | Total ET | Fresh ET | # Positive | % Success | FER | # Positive | % success | PGD | # Positive |
1 | January | In house | 21 | 13 | 4 | 31% | 8 | 2 | 25% | 0 | 0 |
2 | February | In house | 30 | 22 | 10 | 45% | 8 | 4 | 50% | 0 | 0 |
3 | March | In house | 17 | 14 | 4 | 29% | 3 | 0 | 0% | 0 | 0 |
4 | April | In house | 13 | 8 | 3 | 38% | 5 | 2 | 40% | 0 | 0 |
5 | May | In house | 13 | 9 | 5 | 56% | 4 | 1 | 25% | 0 | 0 |
6 | June | In house | 20 | 19 | 12 | 63% | 1 | 1 | 100% | 0 | 0 |
7 | July | In house | 30 | 23 | 9 | 39% | 7 | 5 | 71% | 0 | 0 |
8 | August | In house | 23 | 19 | 12 | 63% | 4 | 0 | 0% | 0 | 0 |
9 | September | In house | 15 | 14 | 8 | 57% | 1 | 0 | 0% | 0 | 0 |
10 | October | In house | 28 | 26 | 10 | 38% | 2 | 2 | 100% | 0 | 0 |
11 | November | In house | 16 | 12 | 2 | 17% | 4 | 1 | 25% | 0 | 0 |
12 | December | In house | 15 | 12 | 6 | 50% | 3 | 2 | 67% | 0 | 0 |
| Totals |
| 241 | 191 | 85 | 45% | 50 | 20 | 40% | 0 | 0 |
Overall Fresh ET success rates: 45%
Overall FER success rates:40%
Overall success rates:44%
No PGD procedures performed in 2020
Bar graph highlighting Fresh ET and FER success rates in the year 2020
LIFC IVF STATS SUMMARY JANUARY TO DECEMBER 2018
A: Tabulated summary of 2021 IVF Data.
SN | Month/cycle 2021 | Embryologist | Total ET | Fresh ET | # Positive | % Success | FER | # Positive | % success | PGD | # Positive |
1 | January | In house | 26 | 17 | 2 | 11.76% | 9 | 5 | 55.5% | 0 | 0 |
2 | February | In house | 19 | 16 | 5 | 31.25% | 3 | 1 | 33.3% | 0 | 0 |
3 | March | In house | 19 | 15 | 5 | 33.3% | 4 | 1 | 25% | 0 | 0 |
4 | April | In house | 16 | 16 | 6 | 37.5% | 0 | 0 | 0% | 0 | 0 |
5 | May | In house | 27 | 17 | 3 | 17.6% | 10 | 10 | 100% | 0 | 0 |
6 | June | In house | 30 | 25 | 10 | 40% | 6 | 2 | 33.3% | 0 | 0 |
7 | July | In house | 16 | 9 | % | 7 | % | 0 | 0 | ||
8 | August | % | % |
|
| ||||||
9 | September | % | % |
|
| ||||||
10 | October | % | % | ||||||||
11 | November | % | % | ||||||||
12 | December | % | % | ||||||||
| Totals |
| % | % |